As I have said before, correlations are important when investing. Low and negatively correlated assets are used together in various investing strategies.
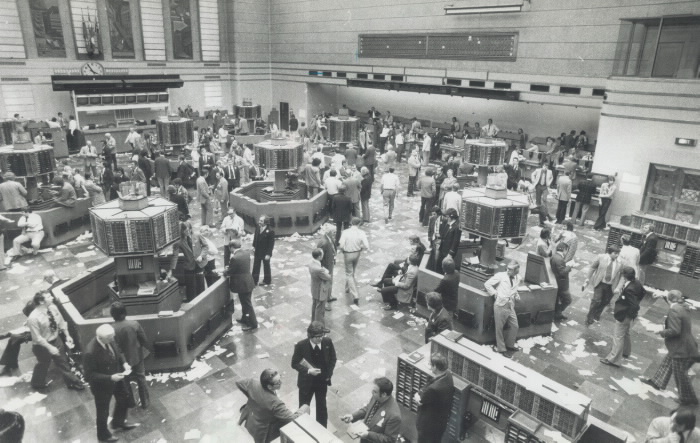
For those who mostly invest in the stock market, it is important to identify these relationships. Yet there are not many resources to find out historical relationships between industries. That’s why I compiled the various S&P/TSX Indices into one “Correlation Matrix”. These are the correlations between the various industries which make up the TSX.
Note that the names of the Indexes are shortened to compact the image. For example, “Mid Cap” is the “S&P/TSX Canadian MidCap” (SPTSEM), “Financials” is the “S&P/TSX Canadian Financials” (SPTTFS), etc. I felt the need to write “Gold (Index)” because it would be especially easy to think that it refers to gold the commodity. All of the underlying data is from Investing.com.
Honorable Mentions
Market Cap
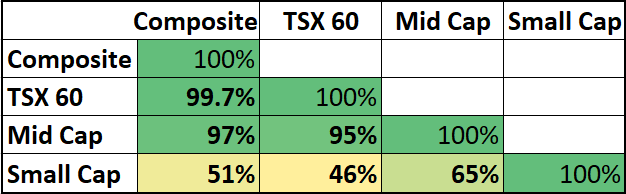
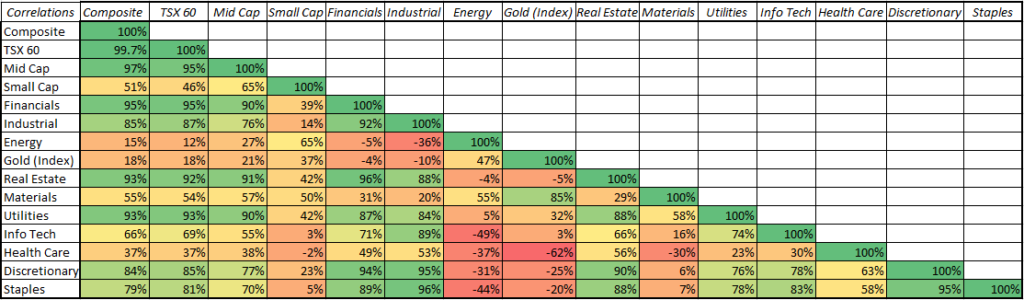
The larger the market cap, the higher the correlation with the Composite Index. Note that the S&P/TSX 60 is a Large Cap index. One possible explanation for this that I have heard is that small caps depend more on the state of a local economy, versus large caps which depend more on the larger national/global economy. Therefore, we should see a more varied reaction to overall market trends among small caps.
An alternative explanation is that the TSX 60 is actually a component of the composite index. This is certainly a factor.
Gold & Energy
Gold & Energy have the lowest correlations with the Composite Index. In fact, they have a closer relationship with themselves than with the index as a whole.
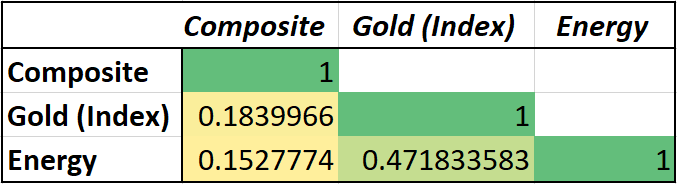
Consequently, Gold & Energy may work well as a hedge against overall market movements. Interestingly, the Materials index has a higher correlation with the overall market than the Gold Index.
Gold & Energy also stand out as moving opposite to many other industries.
Take a look for yourself!
Take a look for yourself. This is a terrific road map for navigating the ups and downs of the stock market as a whole, as well as the various industries it is composed of.
Although stock market dogmatists and economists will tell you how the market should move, this is how it has moved over the last 20 years (minus one month).
Other notable mentions include the relationship between Financials & Real Estate (~.96), Industrials & Staples (~.96), and Gold & Healthcare (~.62; most negative correlation).


After looking into a
number of the blog articles on your web site, I really
appreciate your technique of writing a blog.
I saved as a favorite
it to my bookmark site list and will
be checking back in the near future. Please check out my
website as
well and let me know what you think.