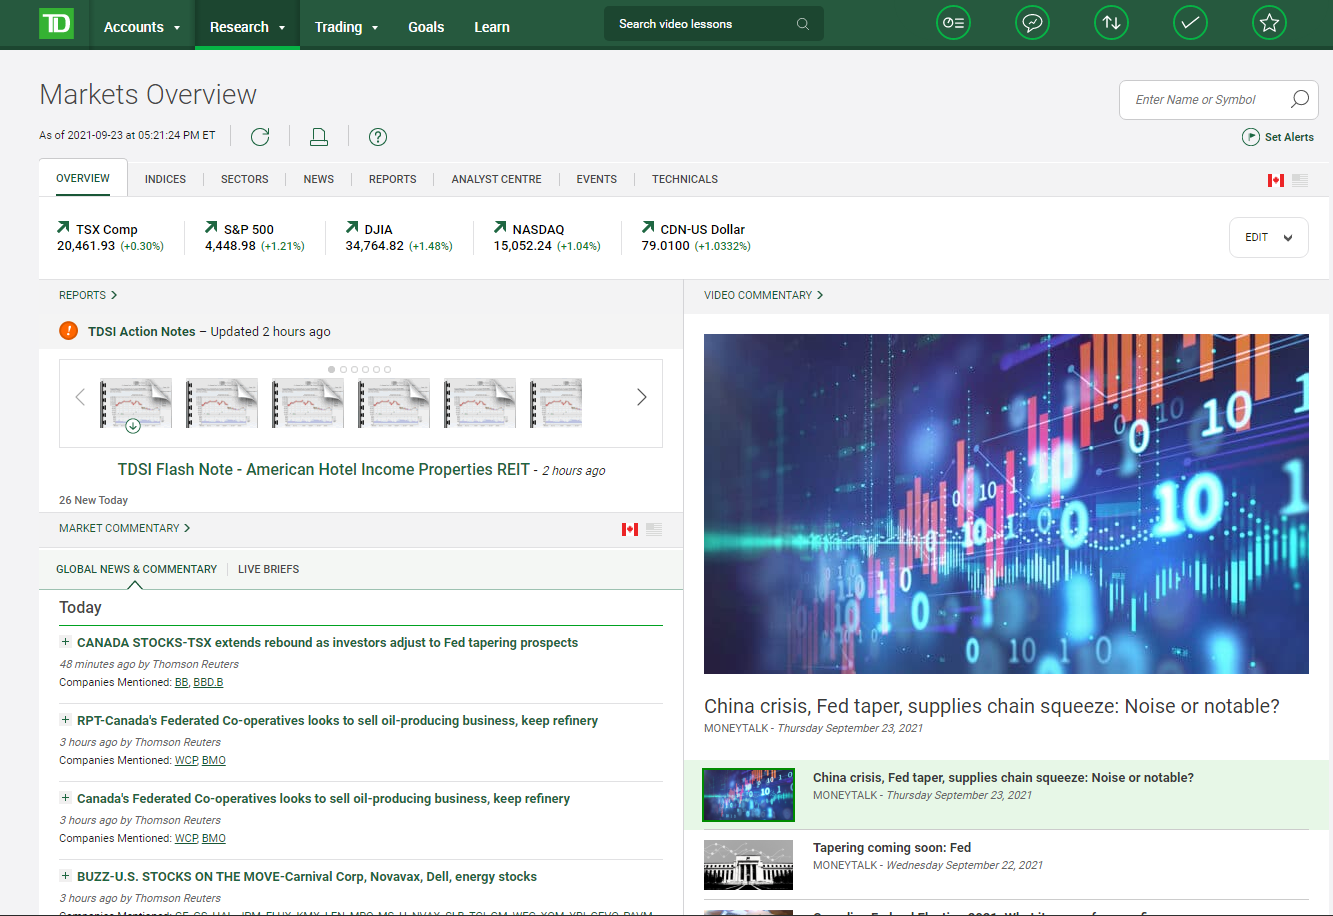
TD’s Webbroker is more of a research platform than a trading platform. From my perspective, the average investor would be eaten alive by the $10/trade fees which are charged on stock trading. Unless you’re making big-boy trades, it’s just not worth it.
But let me tell you something: the research experience of TD Webbroker is really good. The platform enables a new depth of analysis simply not possible on Questrade or WealthSimple. From a research perspective, TD Webbroker is where it’s at.
Research Reports
Research reports on Canadian equities (ie. Stocks) come in three main types: Thomson Reuters+, Morningstar Quant, and Morningstar Analyst.
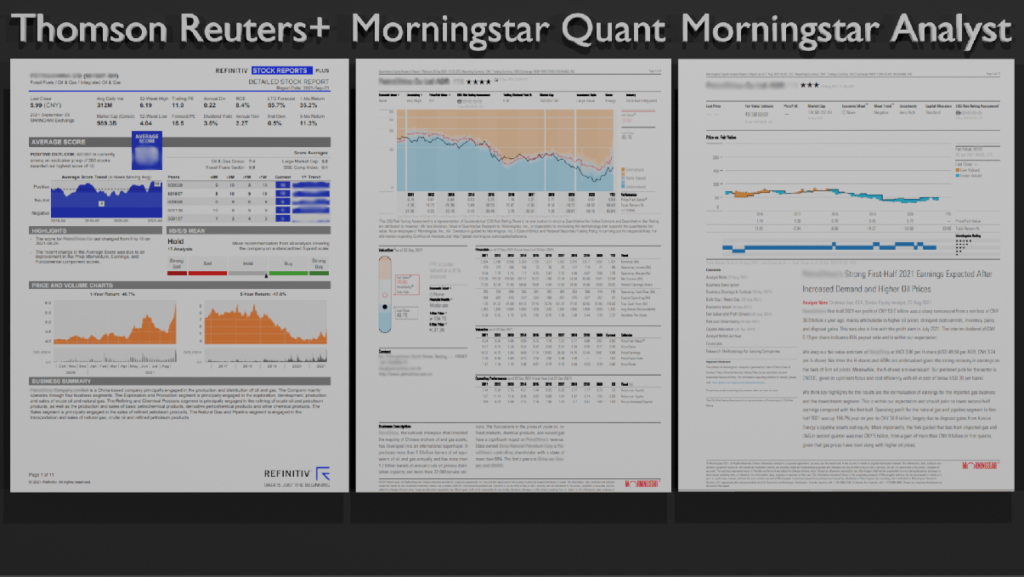
For most equities, you will only be able to find the Thomson Reuters+ report and the Morningstar Quant Report. These two reports are quantitative in nature. They’re focused on the underlying company’s financials. What is good about these reports is that they offer a dynamic picture of the company. In Thomson Reuters reports, for example, you’ll find how the score of the company has changed through time. Meanwhile, the Morningstar Quant report shows you how the valuation has changed over time on multiple metrics. See, it’s all good if a company trades at a P/FCF of 1.0, but if that’s been the case for the last decade… well the stock might just be a dog.
The Morningstar Analyst report is less prolific, but extremely informative. This is especially true when it comes to understanding the competitive environment in which the business operates. Morningstar reports are especially concentrated on the so-called “moat” of the business, which is the competitive advantage of the business. Think of the “moat” as a barrier to entry (much like a Medieval moat) which protects the company’s profits going forward from invasive competitors.
Suffice it to say: I find all three reports especially informative and highly recommend their use. The new investor will benefit from these reports, especially if the alternative is random internet clickbait and gossip articles.
Other Reports
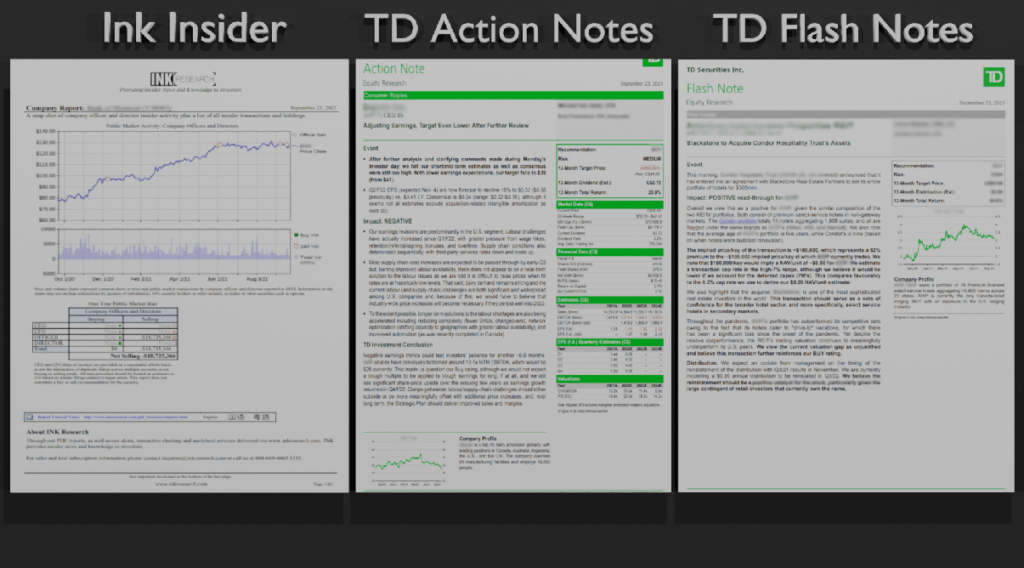
Various other reports are available. INK Insider reports show all recent insider trades for a stock. Daily TD “Action Notes” show the most recent TD Analyst rating changes. TD “Flash Notes” are inter-daily reports for the day-trader, dealing with the most up-to-the-minute intel. It would be smart to remember though, that bank analysts are overly-bullish. It’s simply the nature of the job.
Financials
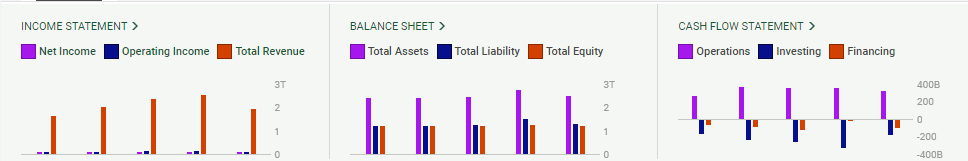
Company financials are three-fold: 1.) Cash-Flow Statement, 2.) Balance Sheet, and 3.) Income Statement. All are available on Quarterly and Annual bases.
Of course, these statements are widely available elsewhere. The value-added by Webbroker is accessibility. For instance, each section of each of the three reports has an explanation. Revenue is explained top-left below.
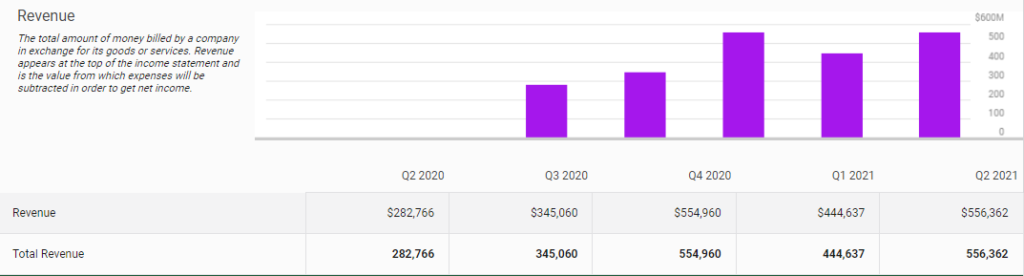
This is a great move by TD to enhance financial literacy. Including these bar graphs also makes the reports much more accessible.
Unfortunately, Quarterly reports only go back five quarters and Annual reports only go back five years. This should not be the case in my opinion, and I think this is the main downfall of the Financial Statements section of the platform. Five years is not a complete view of a company! It is only a start.
Screener
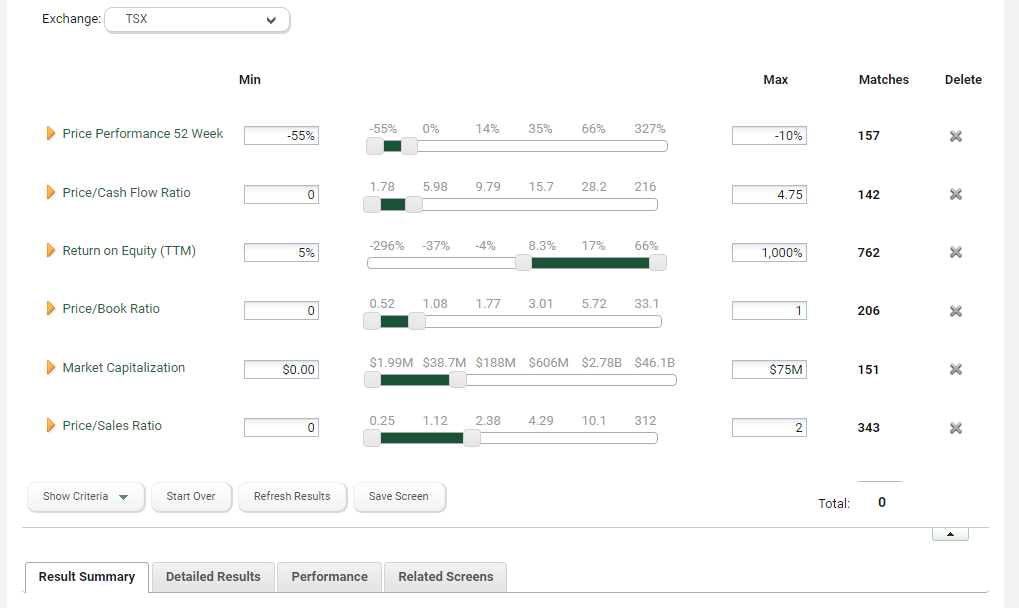
Have you ever heard the saying “let the tool do the work“? Or maybe even “work smarter, not harder“. Well, come on then, it is time to heed this advice and jump into the twenty first century! Screeners (click this link for my article on screeners) are a great tool for the intelligent investor. Fortunately, this platform has a functioning screener and a backtesting tool. Unfortunately though, the backtesting tool only goes back 5 years… What is with this platform and only going back five years?
Anyways, both the screener and the backtester work well in my experience. Again, another tool in the intelligent investors arsenal.
Overall
I recommend my readers try out Webbroker if they want accessible research. I hope that they continue to improve the platform over time to give an even better user experience!
Again, the main downfalls of the platform are the trading fees and the 5-year limit on some historical information.
Let me know what you think in the comment section down below!